 |
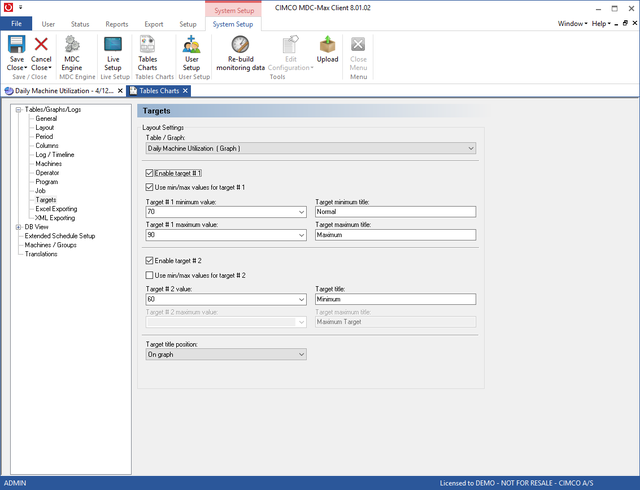
Since these graphs will often be used for motivational purposes, targets can be added to the graphs. Edit the graph report and click Targets on the left. The example below shows target 1 being used to set a normal and maximum target and target 2 being used to set a minimum target.
|
The resultant graph shows the following.
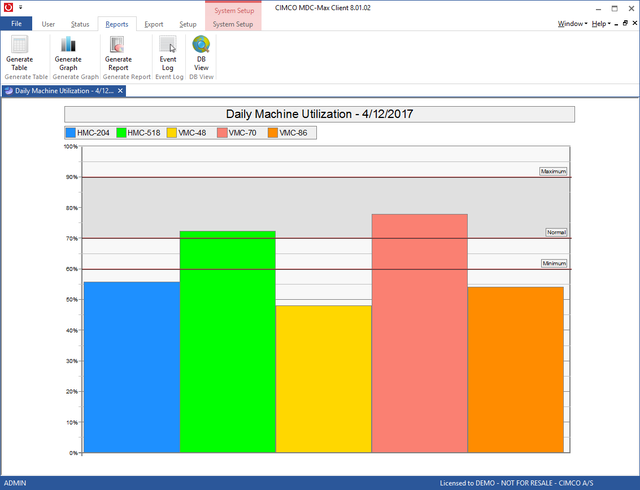 |
The Target1 settings have produced the Maximum and Normal lines on the graph and the grey area between them. The Target2 settings have produced the minimum line.