 |
A Report is simply a collection of graphs and tables collected together into a report. This can then be printed or exported to a PDF file.
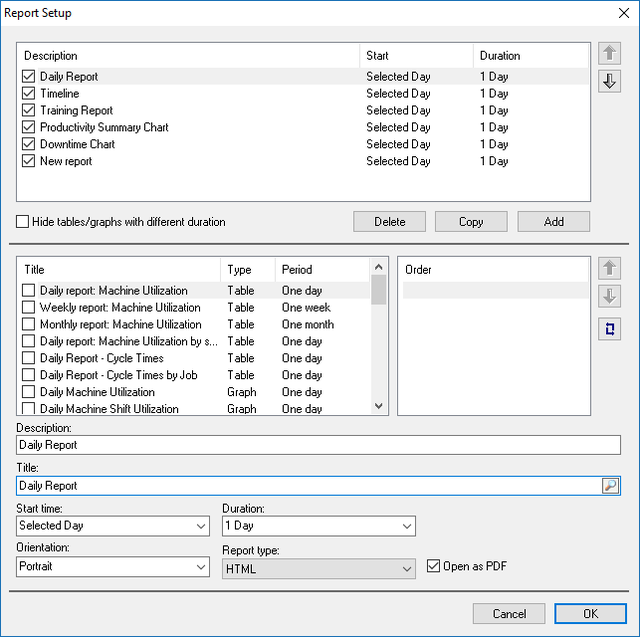
From the MDC-Max client click Setup / Report Setup and then click on the Add button.
|
Type in a description and title for the report then select the start time and period. For a daily report this is normally set to 'Selected Day' and Duration 1 Day.
Next select the tables and graphs you require in the report, as they are selected they will appear in the Order window to the right of the screen. Always make sure that the period of the tables and graphs you are selecting for a report matches the duration of the report you are building.
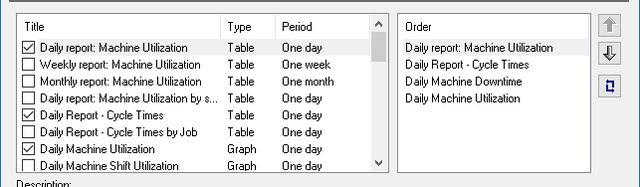 |
Next set the order you wish the tables and graphs to appear in on the report. To do this, highlight the table or graph in the 'Order' box and use the Up and Down arrows to change its position in the list.
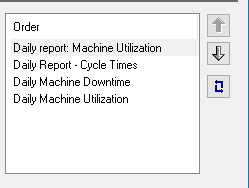 |
The result here is that the Daily Machine Downtime will now appear below the machine utilization table and above the Daily Report Cycle Times. Click the OK button to confirm the report is finished.
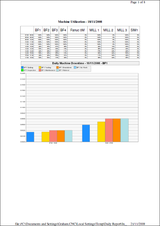
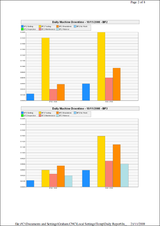
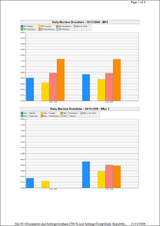
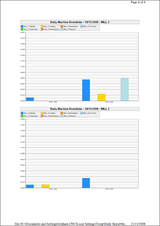
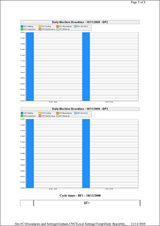
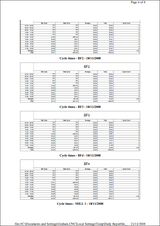
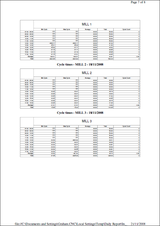
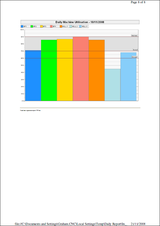
By going to the Reports drop down menu on the MDC page and selecting Generate reports, it should now be possible to select the new daily report, it should create the series of graphs and tables selected, where the graphs or tables had multiple sheets these will all be displayed, they can be printed by clicking the right mouse button and selecting print. The example shown would produce a series of pages similar to the screenshots below.
 |
 |
 |
 |
 |
 |
 |
 |