Dashboards coming to the MDC-Max Web Client
Development of both Dashboards and Shop Floor Screens for the new MDC-Max Web Client is progressing as planned. We expect to release Dashboards sometime during August or September – and Shop Floor Screens around the end of the year. In this post we will take a closer look at the new Dashboards feature.
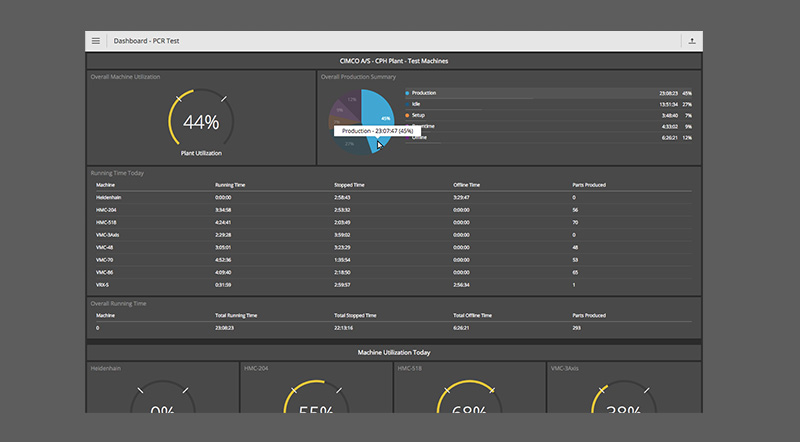
Dashboards provide a great way to get an instant overview of your real-time production data, at a glance. A Dashboard is made up of multiple Widgets that can each visualize data in a specific way. Widget types include Section Header, Gauge, Pie Chart, Bar Chart, Plot Chart, Table and Timeline*. Create multiple Dashboards to focus on different production facilities, different machine groups, different levels of data complexity or other specific needs you may have. The possibilities are many.
Dashboards and Widgets are easily configured through the MDC-Max PC Client and once a Dashboard is saved, the web client automatically updates on all connected devices. Also, thanks to the cutting edge web technologies used, the data in Widgets is continuously updated without the need for refreshing the browser.
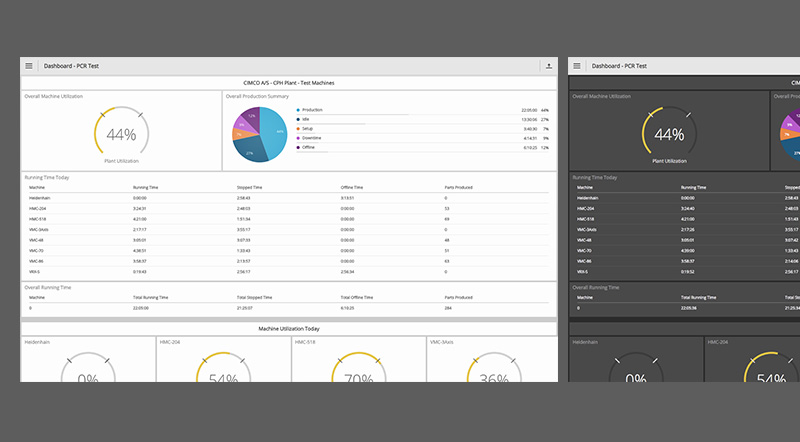
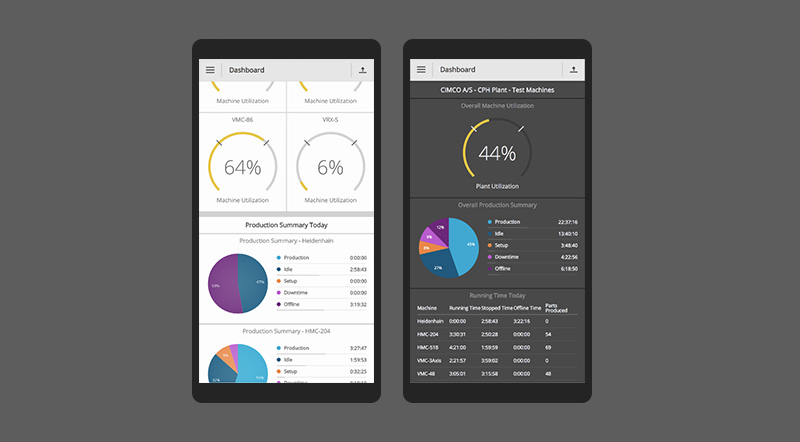
For optimal readability in different lighting conditions (or just personal preference), Dashboards support both Bright and Dark mode. Dashboards are also fully responsive and adapts nicely to any size of screen – desktop, tablet, mobile and TV.
We will post more about Dashboards as we get closer to release.
* Plot Graph and Timeline are not planned for initial release.


