 |
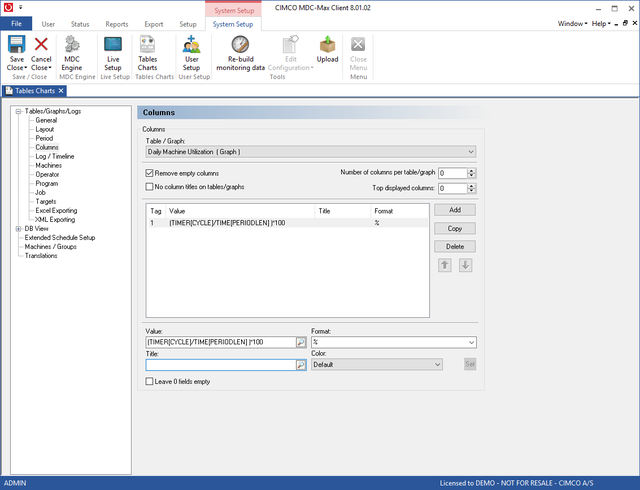
Click on the Columns menu on the left to determine what values are displayed
|
Each graph can display multiple columns of data per machine but in this example we only want the utilization as a percentage. Click into the first Title value and then use the search icon to select TIMER[CYCLE]. This would give us the actual run time in minutes and seconds in that hour.
What we actually want is the percentage runtime for the whole day so we must enter a formula to give us this. The formula we want is:
(TIMER[CYCLE] / TIME[PERIODLEN])*100
I.e. divide the actual runtime by the interval time (1 day) and then multiply by 100 to get a percentage. Always use TIME[PERIODLEN] for the total time in any interval - then if you change the interval to 15M or 1 Day the formula will still work.
Use the search icon to edit the Title value and then scroll to the bottom of values to find TIME[PERIODLEN] and double click to add this into the formula and then type the brackets and the *100.
The Format determines how the data is to be displayed (the drop down menu icon gives a series of valid formats) in this case we use % to display a percentage.
TIMERCNT[CYCLE] to give a part count (format I for integer)
Ticking the No Column Titles on Graphs/graphs cleans up the graph display