 |
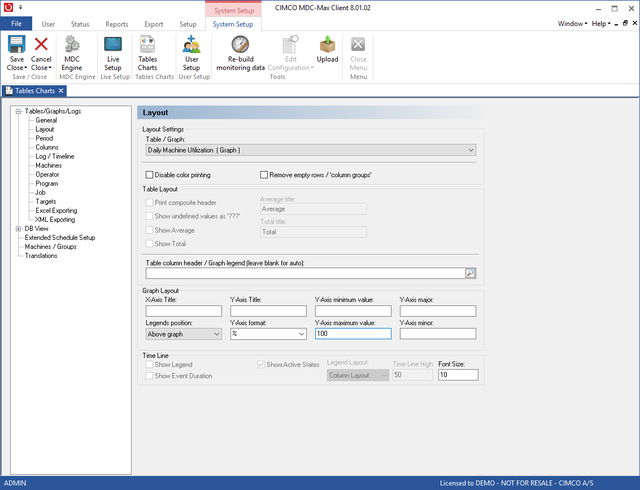
Click on the Layout menu on the left of the screen and the layout page will appear:
|
The layout determines how the data will be laid out on the graph. For our simple utilization graph we leave the graph legend blank, set the Legends position to 'Above Graph' set the Y-\Axis format to % and set the Y-axis maximum value to 100. This will display the utilization as a percentage with 100% as the maximum value on the graph. Each column in our graph will then be named by machine name.
Click on the Period menu on the left to determine the timescale of the Graph.
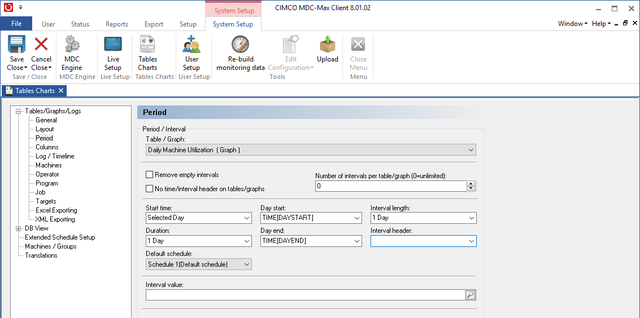 |
"Start Time" and "Duration" determine the total period of the Graph. Selected Day means that when we run the graph the user will be able to select a day from a calendar. We want to report on a single day so the duration is 1 day.
The interval length determines how many rows of data will be generated for each machine per day. If we set this to 1 Day then we will get a row per machine for the total utilization for that day. The "Day Start" field is set to TIME[DAYSTART] - this means the graph will start at the beginning of the first shift.
The "Day End" is set to TIME[DAYEND] so the graph ends at the end of the final shift.
If your first shift starts at 6 am and you run three shifts ending at 6 the next morning, the graph above will run from 6 to 6, not from Midnight to Midnight.