 |
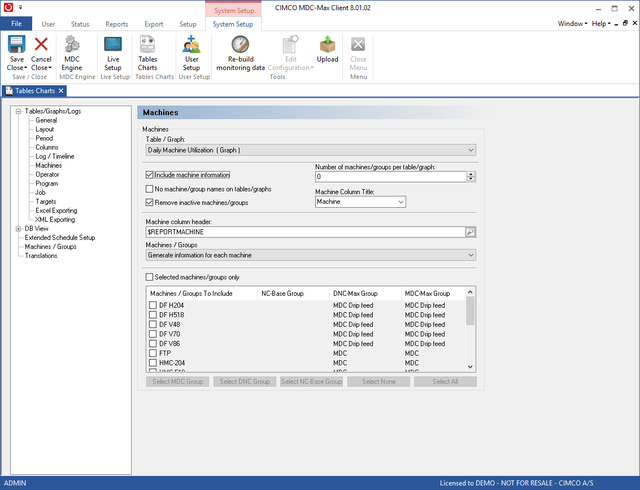
Finally click the Machines menu on the left to edit machine info. This page determines how the data is displayed by machine and what machines to include.
|
Tick the "Include machine information" field and this will break the graph into individual machine totals.
The "Number of machines/groups per graph/graph" field determines how many machines will be displayed on each page. If you have a large number of machines, set this to 8 and you will only get 8 machines per graph.
Ticking "Remove inactive machines/groups" stops the graph displaying empty columns for inactive machines where there is always zero utilization. The 'Machine column header' determines what is displayed at the top of each column.
Here is the chart generated by the settings in our screen shots:
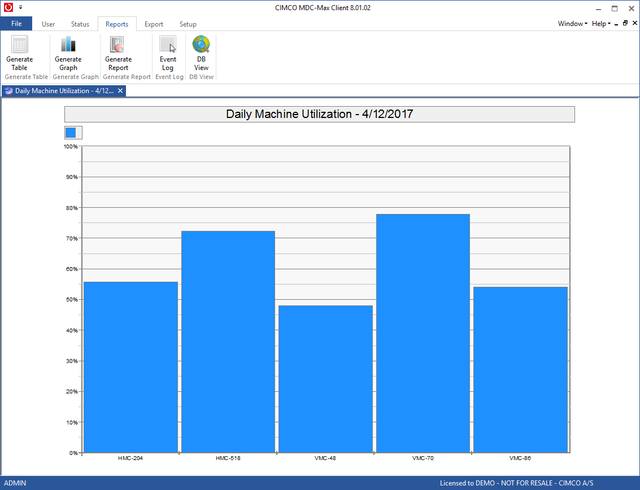 |
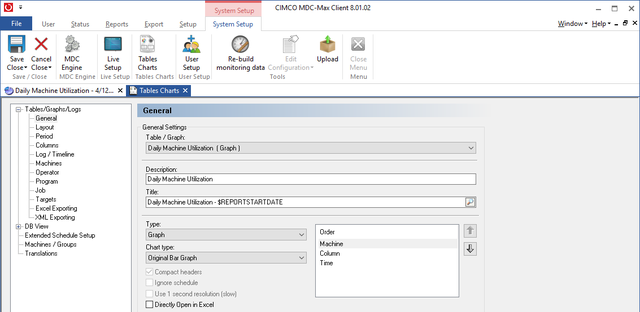
This has the machine names across the bottom of the graph. This can be further refined by going to the general menu and changing the Order to put the machines first as below.
 |
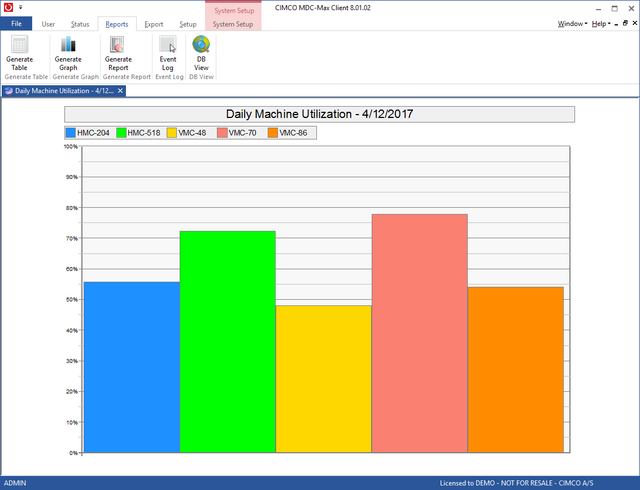
This then produces a graph with the machine names on a colour coded legend:
 |