 |
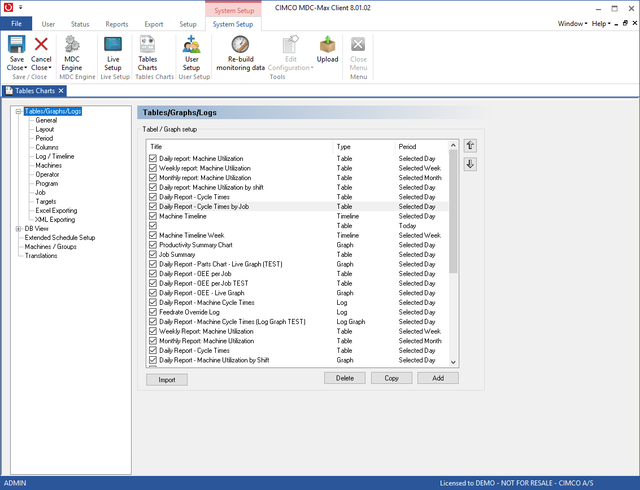
For our first Graph we will create a simple machine utilization graph. On the main MDC-Max screen click Setup, System Setup then click on the 'Tables/Graphs' link on the left.
|
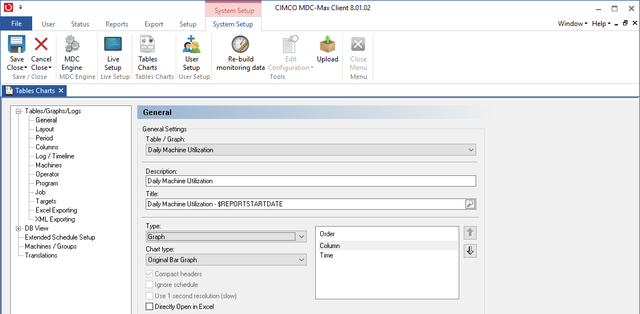
Click the Add button to see the screen below and type a description in the Description field - this is the name of the graph. Type a title in the Title field - this is what is displayed on the actual Graph in this case the $REPORTSTARTDATE will display the date on the top of the graph.
The type must be set to Graph - this produces a bar chart.
 |