 |
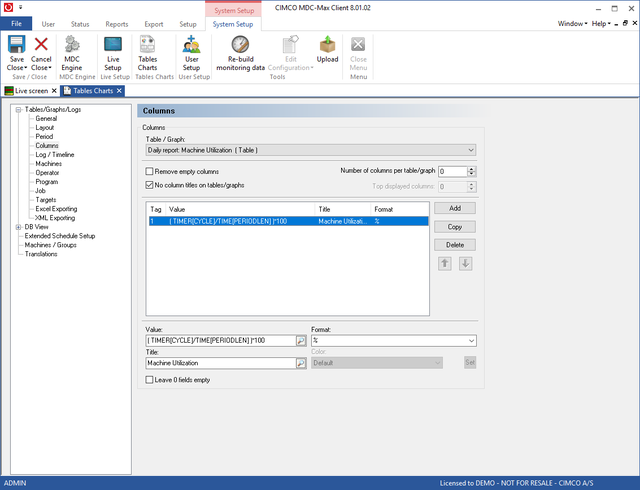
Click on the Columns menu on the left to determine what values are displayed
|
Each table can display multiple columns of data per machine but in this example we only want the utilization as a percentage. Click on the first Title value and then use the search icon to select TIMER[CYCLE]. This would give us the actual run time in minutes and seconds in that hour.
What we actually want is the percentage runtime in each hour so we must enter a formula to give us this. The formula we want is:
(TIMER[CYCLE] / TIME[PERIODLEN])*100
I.e. divide the actual runtime by the interval time (1 hour) and then multiply by 100 to get a percentage. Always use TIME[PERIODLEN] for the total time in any interval - then if you change the interval to 15M or 1 Day the formula will still work.
Use the search icon to edit the Title value and then scroll to the bottom of values to find TIME[PERIODLEN] and double click to add this into the formula and then type the brackets and the *100.
The Format determines how the data is to be displayed (the drop down menu icon gives a series of valid formats) in this case we use % to display a percentage.
Other typical values for the title and format are:
TIMER[CYCLE] to give the total running time (set format to MS for minutes/secs)
TIMERMIN[CYCLE] to give a minimum cycle time (format MS)
TIMERMAX[CYCLE]to give a maximum cycle time (format MS)
TIMERAVG[CYCLE] to give an average cycle time (format MS)
TIMERCNT[CYCLE] to give a part count (format I for integer)