 |
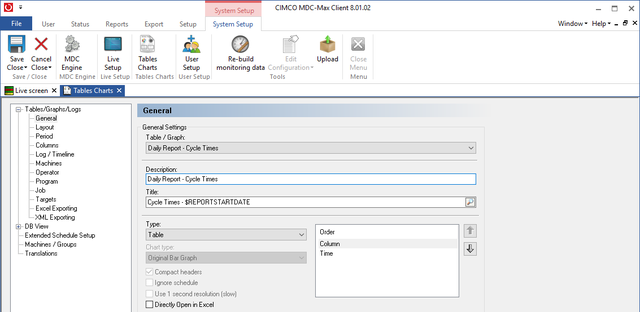
Click Setup, System Setup, highlight Tables/Graphs on the left and click the Add button.
Add the following:
|
Click Layout on the left and fill out as below:
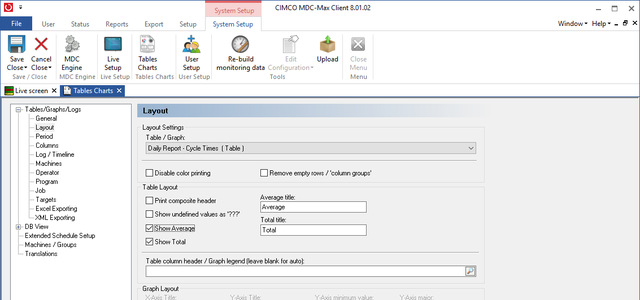 |
Notice here that we have ticked Show Average and Show Total. The average is only really useful if the machine is running the same job continuously. The total will give you the total runtime that day.
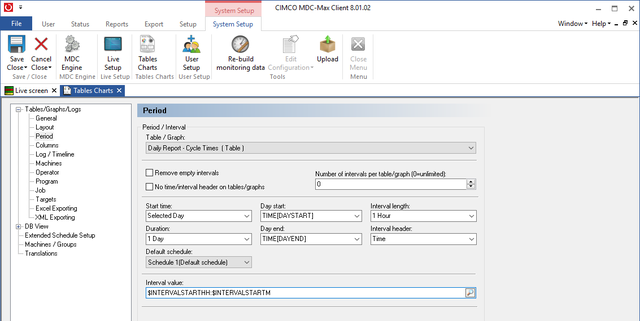
Click Period on the left and fill out as below (this is the same as the Period for the daily machine utilization table).
 |
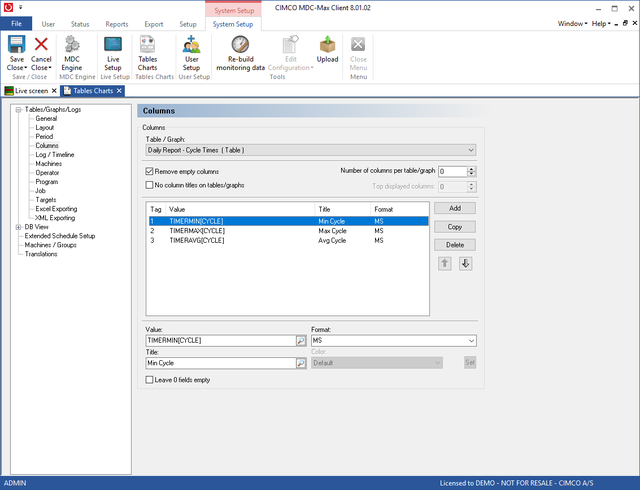
Click Columns on the left. In the machine utilization table we only had one value, for the cycle times it would be useful to have the minimum, maximum and the average cycle time. We will also add the part count to the same table.
Click into Column 1 Value and use the search icon to add TIMERMIN[CYCLE], set the title to Min Cycle and the format to MS.
Add the Max and average yourself - it should look like below:
 |
Finally we add the cycle count in column 4 as TIMERCNT[CYCLE], the title as Cycle Count and the format as I (for integer) as below:
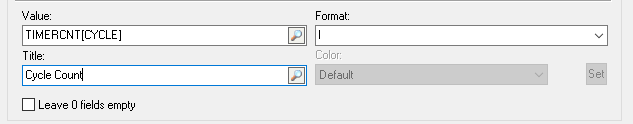 |
Click Machines on the left and tick include machine information and OK the setup.
Click Report, Generate table and you will see:
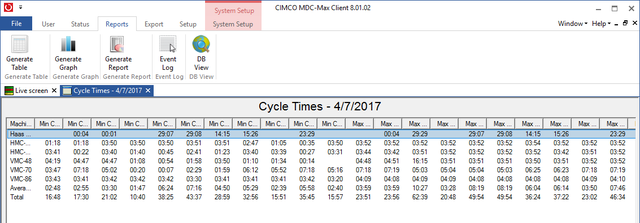 |
This is not what we want as it gives us an individual column for the first value (Min Cycle) for each time interval, followed by an individual column for the second value (Max Cycle) for each time interval and so on. What we really want is Min, Max, Avg and cycle count for each machine in successive columns.