Timelines now available in the MDC-Max Web Client
We are excited to introduce Timelines in the MDC-Max Web Client.
Timelines are a key feature in the MDC-Max PC client, and now you can also use them in our webclient – as a new type of widget in Dashboards.
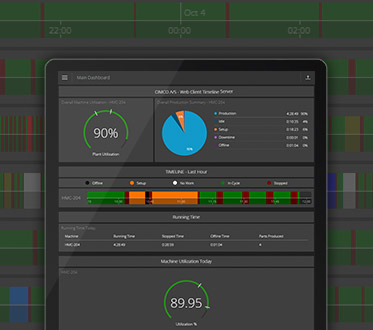
For those less familiar with Dashboards, they allow you to visualize and interact with the real-time production data of your machines in a graphical way. Dashboards are composed of widgets such as Bar graph, Pie chart, Value list, Gauge, and more. They can focus on different aspects of your shop floor, such as different facilities, machine groups, data complexity, or specific needs.
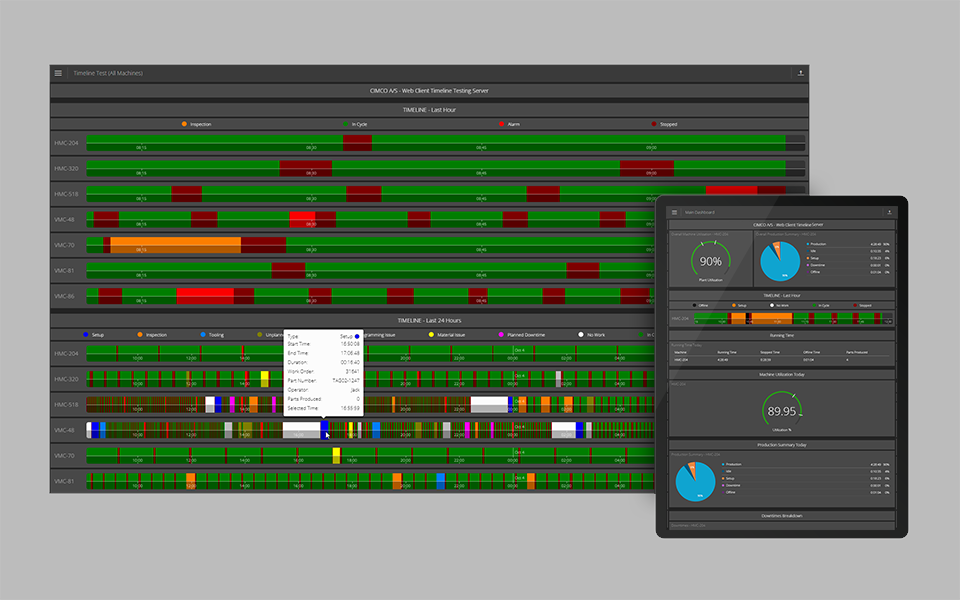
With Timelines, you can create customized dashboards for each machine or for your entire shop floor, by adding a single or multiple timelines along with other widgets such as Charts and Gauges. You can see the status of your machines over different timespans, such as the last hour or the last 7 days, and magnify an area to see more detail.
Hover over any color on the timeline to get more information about the machine state at that point, such as downtime reason, operator name, job number, part number, parts produced at that time, and more.
Timelines are updated in real-time, thanks to the latest web technologies that power our webclient and roll forward as data comes in. You don’t need to reload your browser to see the latest data from your machines.
In short, Timelines give you a quick overview and insights into your machine utilization over time. You can analyze the reliability and potential problems of each machine, as well as compare and contrast different machines or periods of time.
If you want to learn more about Timelines, please contact us or visit our product page to learn more about CIMCO MDC-Max – our machine data collection and monitoring solution.


